How-to guide
Short answers for the property map. Type what you want to do and the matching topics move to the top.
Open the Data Layers panel
Click the Data Layers button above the property list, next to the results count. The list flips to the layer picker. Click the button again (it now reads Listings) to get your property cards back. Layers you turned on stay on.
Turn a layer on or off
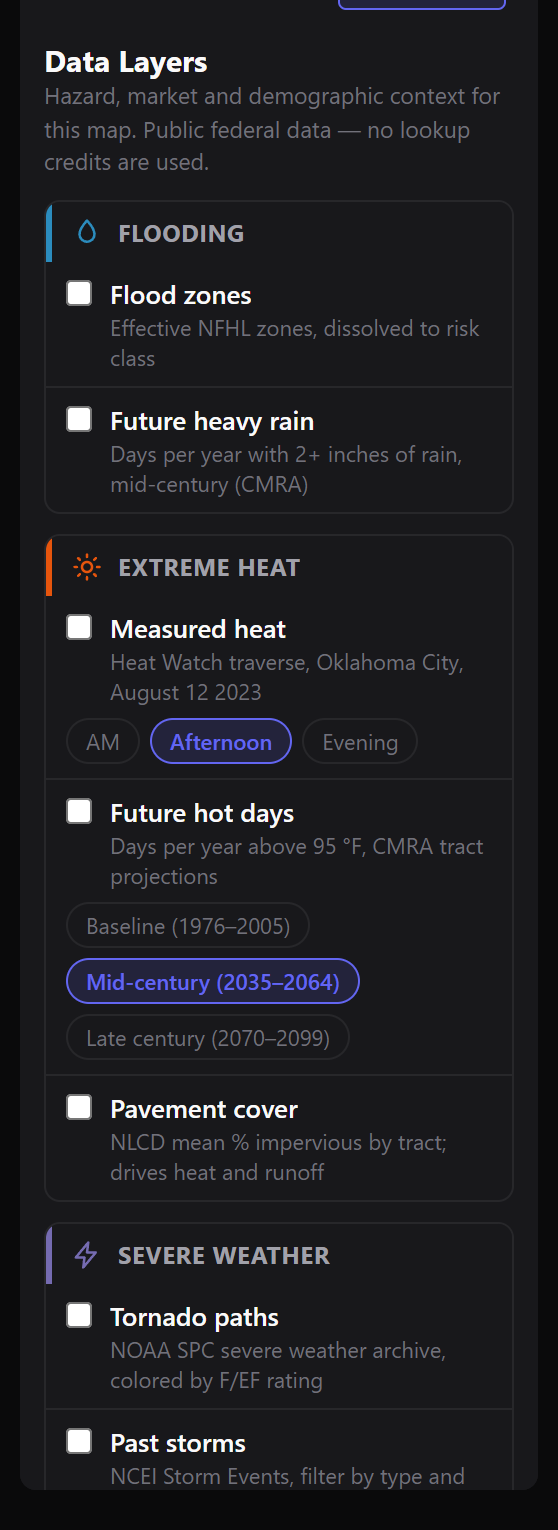
Tick a layer's checkbox in the panel. Layers sit in seven groups: Flooding, Extreme heat, Severe weather, Loss & insurance, Property & market, People & vulnerability, and Context. Run as many at once as you like; the newest one draws on top. A greyed-out row means the data is not available on this map, and the row's note says why.
Layers draw from files bundled with the site. Turning one on uses no lookup credits.
Read the legend
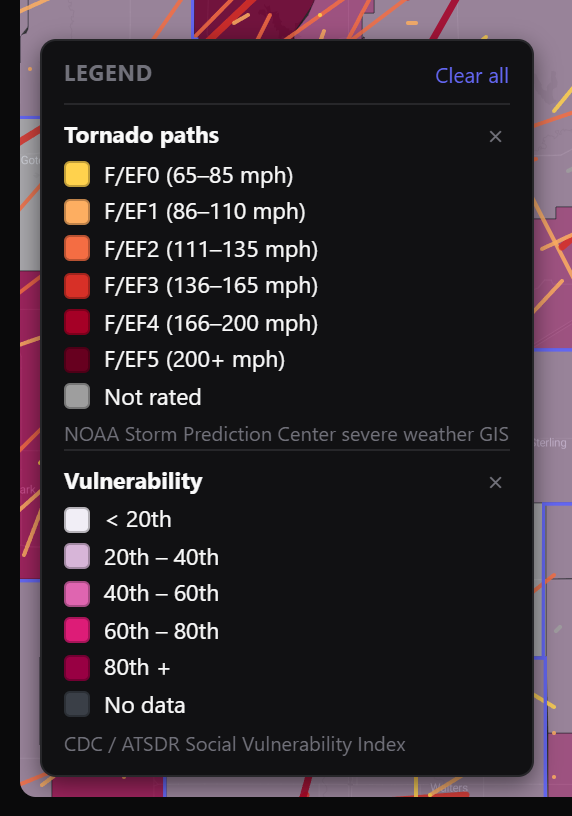
The legend appears at the bottom left of the map whenever a layer is on. The layer you added last is listed first. Each block shows the color scale, the source credit, and an × that turns that one layer off. Clear all at the top turns everything off at once.
The grey swatch marked No data is its own class: the source could not score that area. A tract that scored zero gets a color; a tract with no answer gets grey.
Clicking still looks up properties
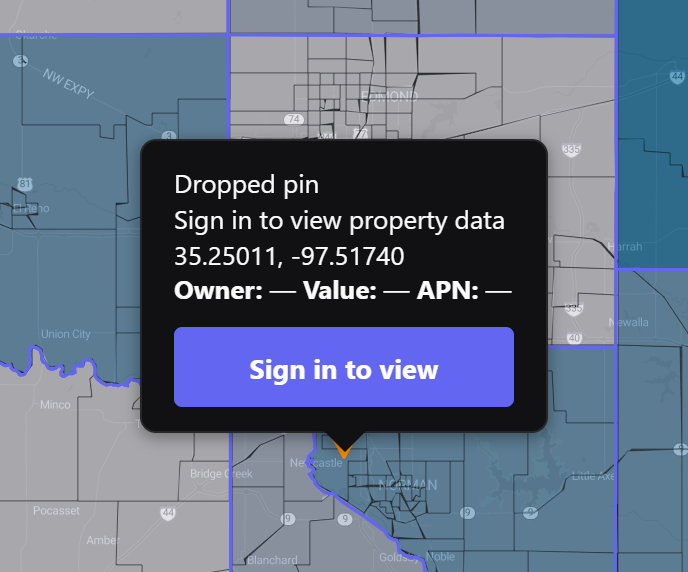
Layers are an overlay, not a mode. With any layer on, a click does what it always does: drops a pin and opens the property lookup for that spot, with owner, value and APN. The layers never capture your click. To read what a tract's color means, use the legend at the bottom left.
Switch what a layer measures
Some layers carry more than one measure. Rows for those layers grow an extra control once you look for it:
- People has a dropdown: seniors, young children, poverty, car-free households. Pick one and the map re-colors in place.
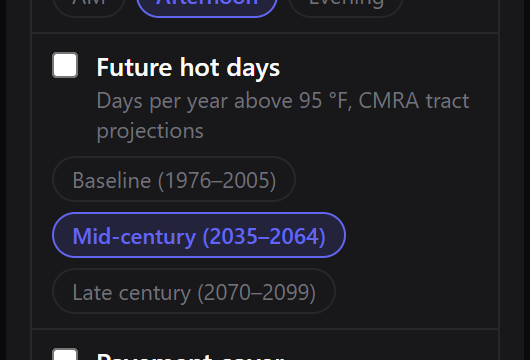
- Future hot days and Future heavy rain have period buttons for early, mid and late century projections.
- Measured heat has time-of-day buttons: the morning, afternoon and evening passes of the 2023 Oklahoma City campaign.
Switching a measure recomputes the color classes and updates the legend.
Flood zones look empty? Zoom in
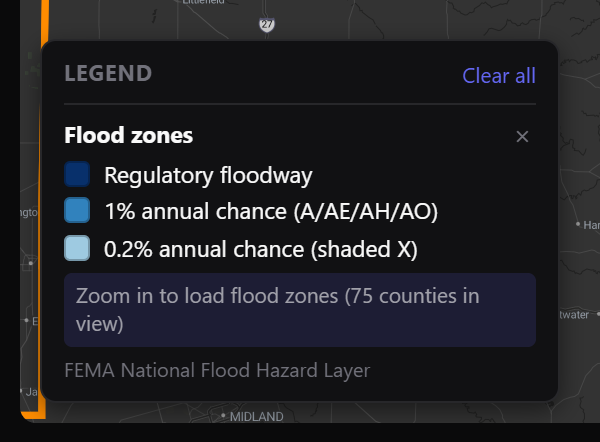
Flood zones is the one layer too large to load statewide, so it loads county by county as you pan. With more than eight counties on screen it waits, and the legend says so: “Zoom in to load flood zones”. Zoom until fewer counties fill the view and the polygons arrive.
A county that stays blank up close has no effective FEMA flood panels published. That means unmapped, not safe.
Check what's on without opening the panel
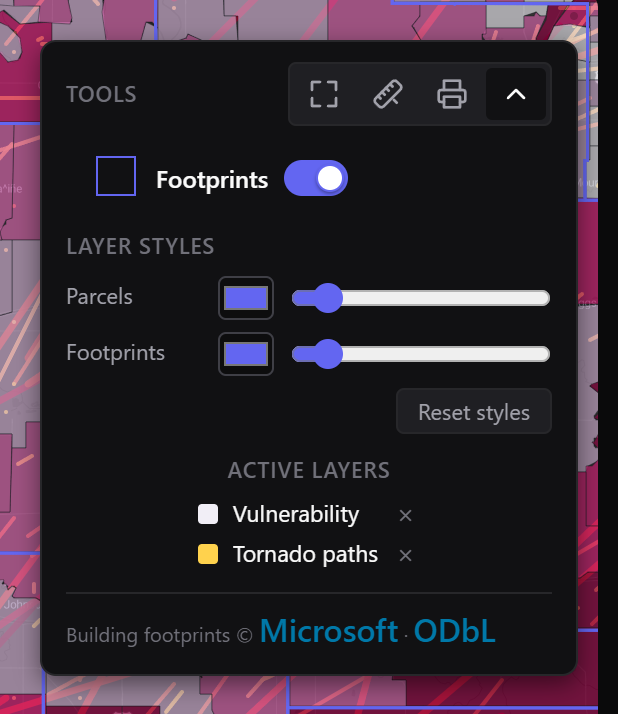
The map control panel at the top right grows an Active layers section while any data layer is on. Each row shows the layer's color dot, its name, and an × to turn it off from there.
Switch between light and dark mode
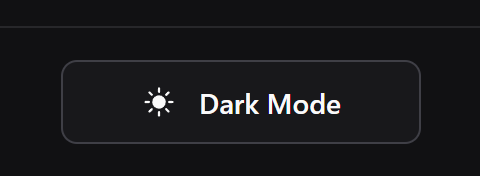
Click the sun / moon button at the bottom of the left navigation bar. The label tells you which mode you are in. Your choice saves to this browser and holds the next time you visit. The basemap follows along: dark mode gets a dark map, light mode a light one.
Switch to satellite imagery
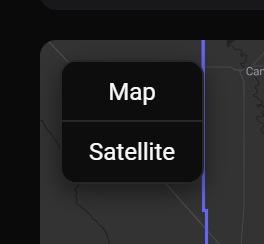
Use the Map / Satellite switch on the map. Map is the drawn basemap in your current theme; Satellite is aerial imagery with labels. Parcels, footprints and data layers draw over either one.
Fullscreen, measure and print
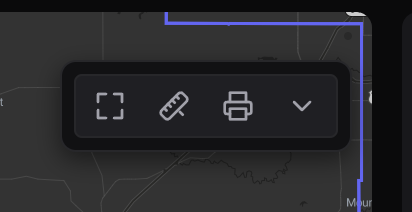
The Tools row of the map control panel (top right) holds three buttons:
- Fullscreen expands the map to fill your screen; press it again or hit Escape to leave.
- Measure turns your cursor into a ruler. Click the map to plot points along a path; double-click to finish and read the distance.
- Print prints the current map view.
Change parcel and footprint line styles
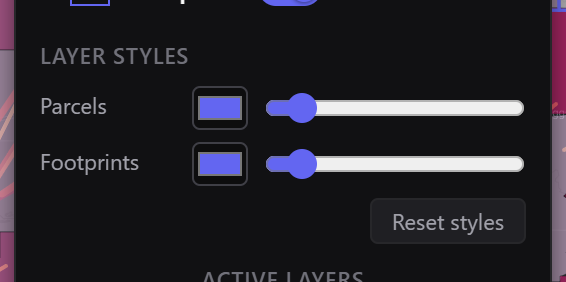
Open the map control panel with its chevron button. The Layer Styles section has a color swatch and a thickness slider for parcel lines and another pair for building footprints. Reset styles restores the defaults.
Signed in, your styles save to your account and follow you across devices. Signed out, they save to this browser.
The Footprints switch in the same panel turns building outlines on or off. Over Oklahoma they start off, because the county parcel layers carry richer data there.
Find a property by address
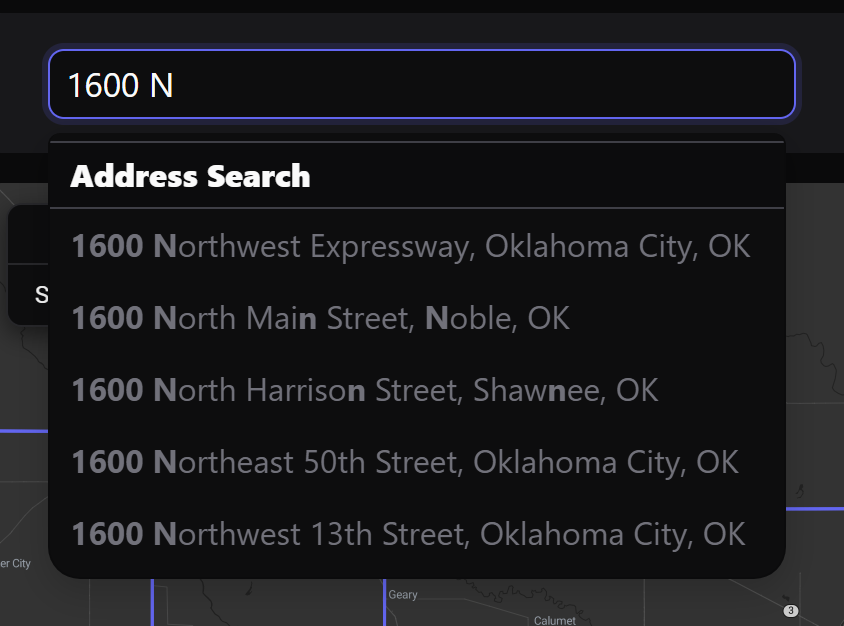
Type an address into the Property Search box at the top of the map and pick from the suggestions. Picking one opens that property's record. Searching is free; opening the record uses lookup credits.
Select a property on the map
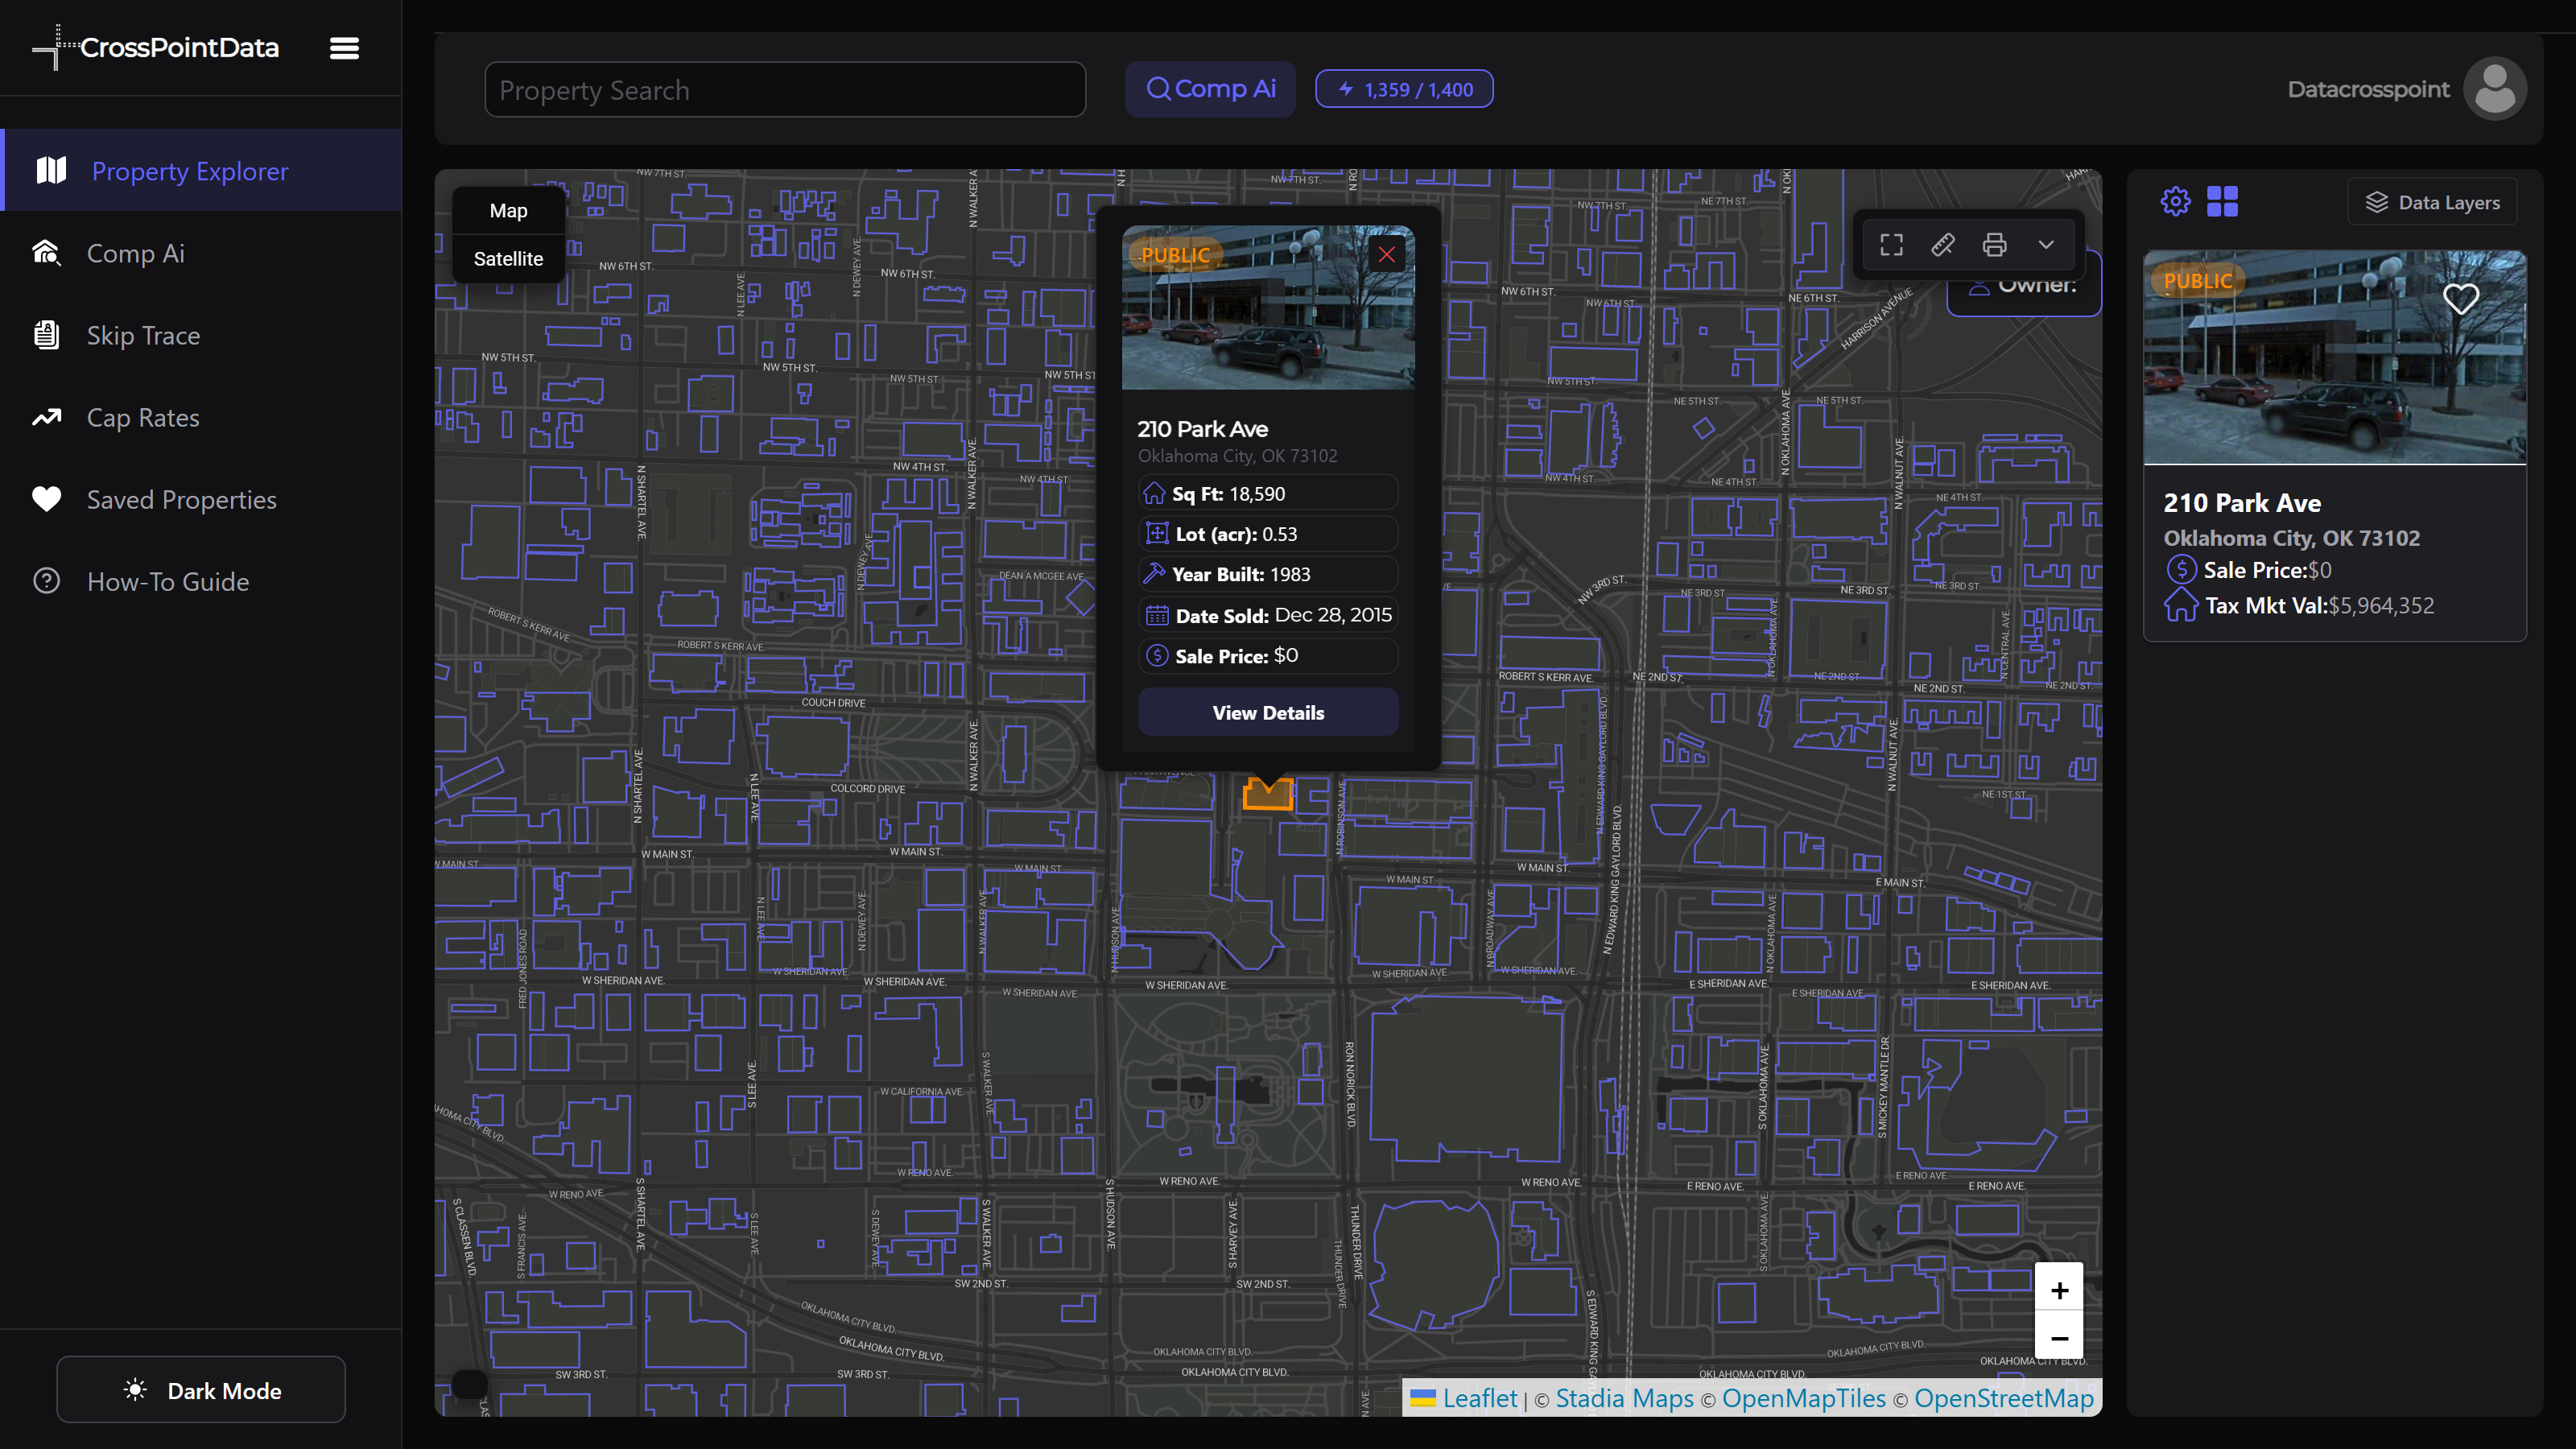
Zoom in until parcel outlines draw, then click one. The parcel highlights and a preview card pops up with the photo, square footage, lot size, year built and last sale, pinned from public county data. Click View Details to open the full record.
Read the property record
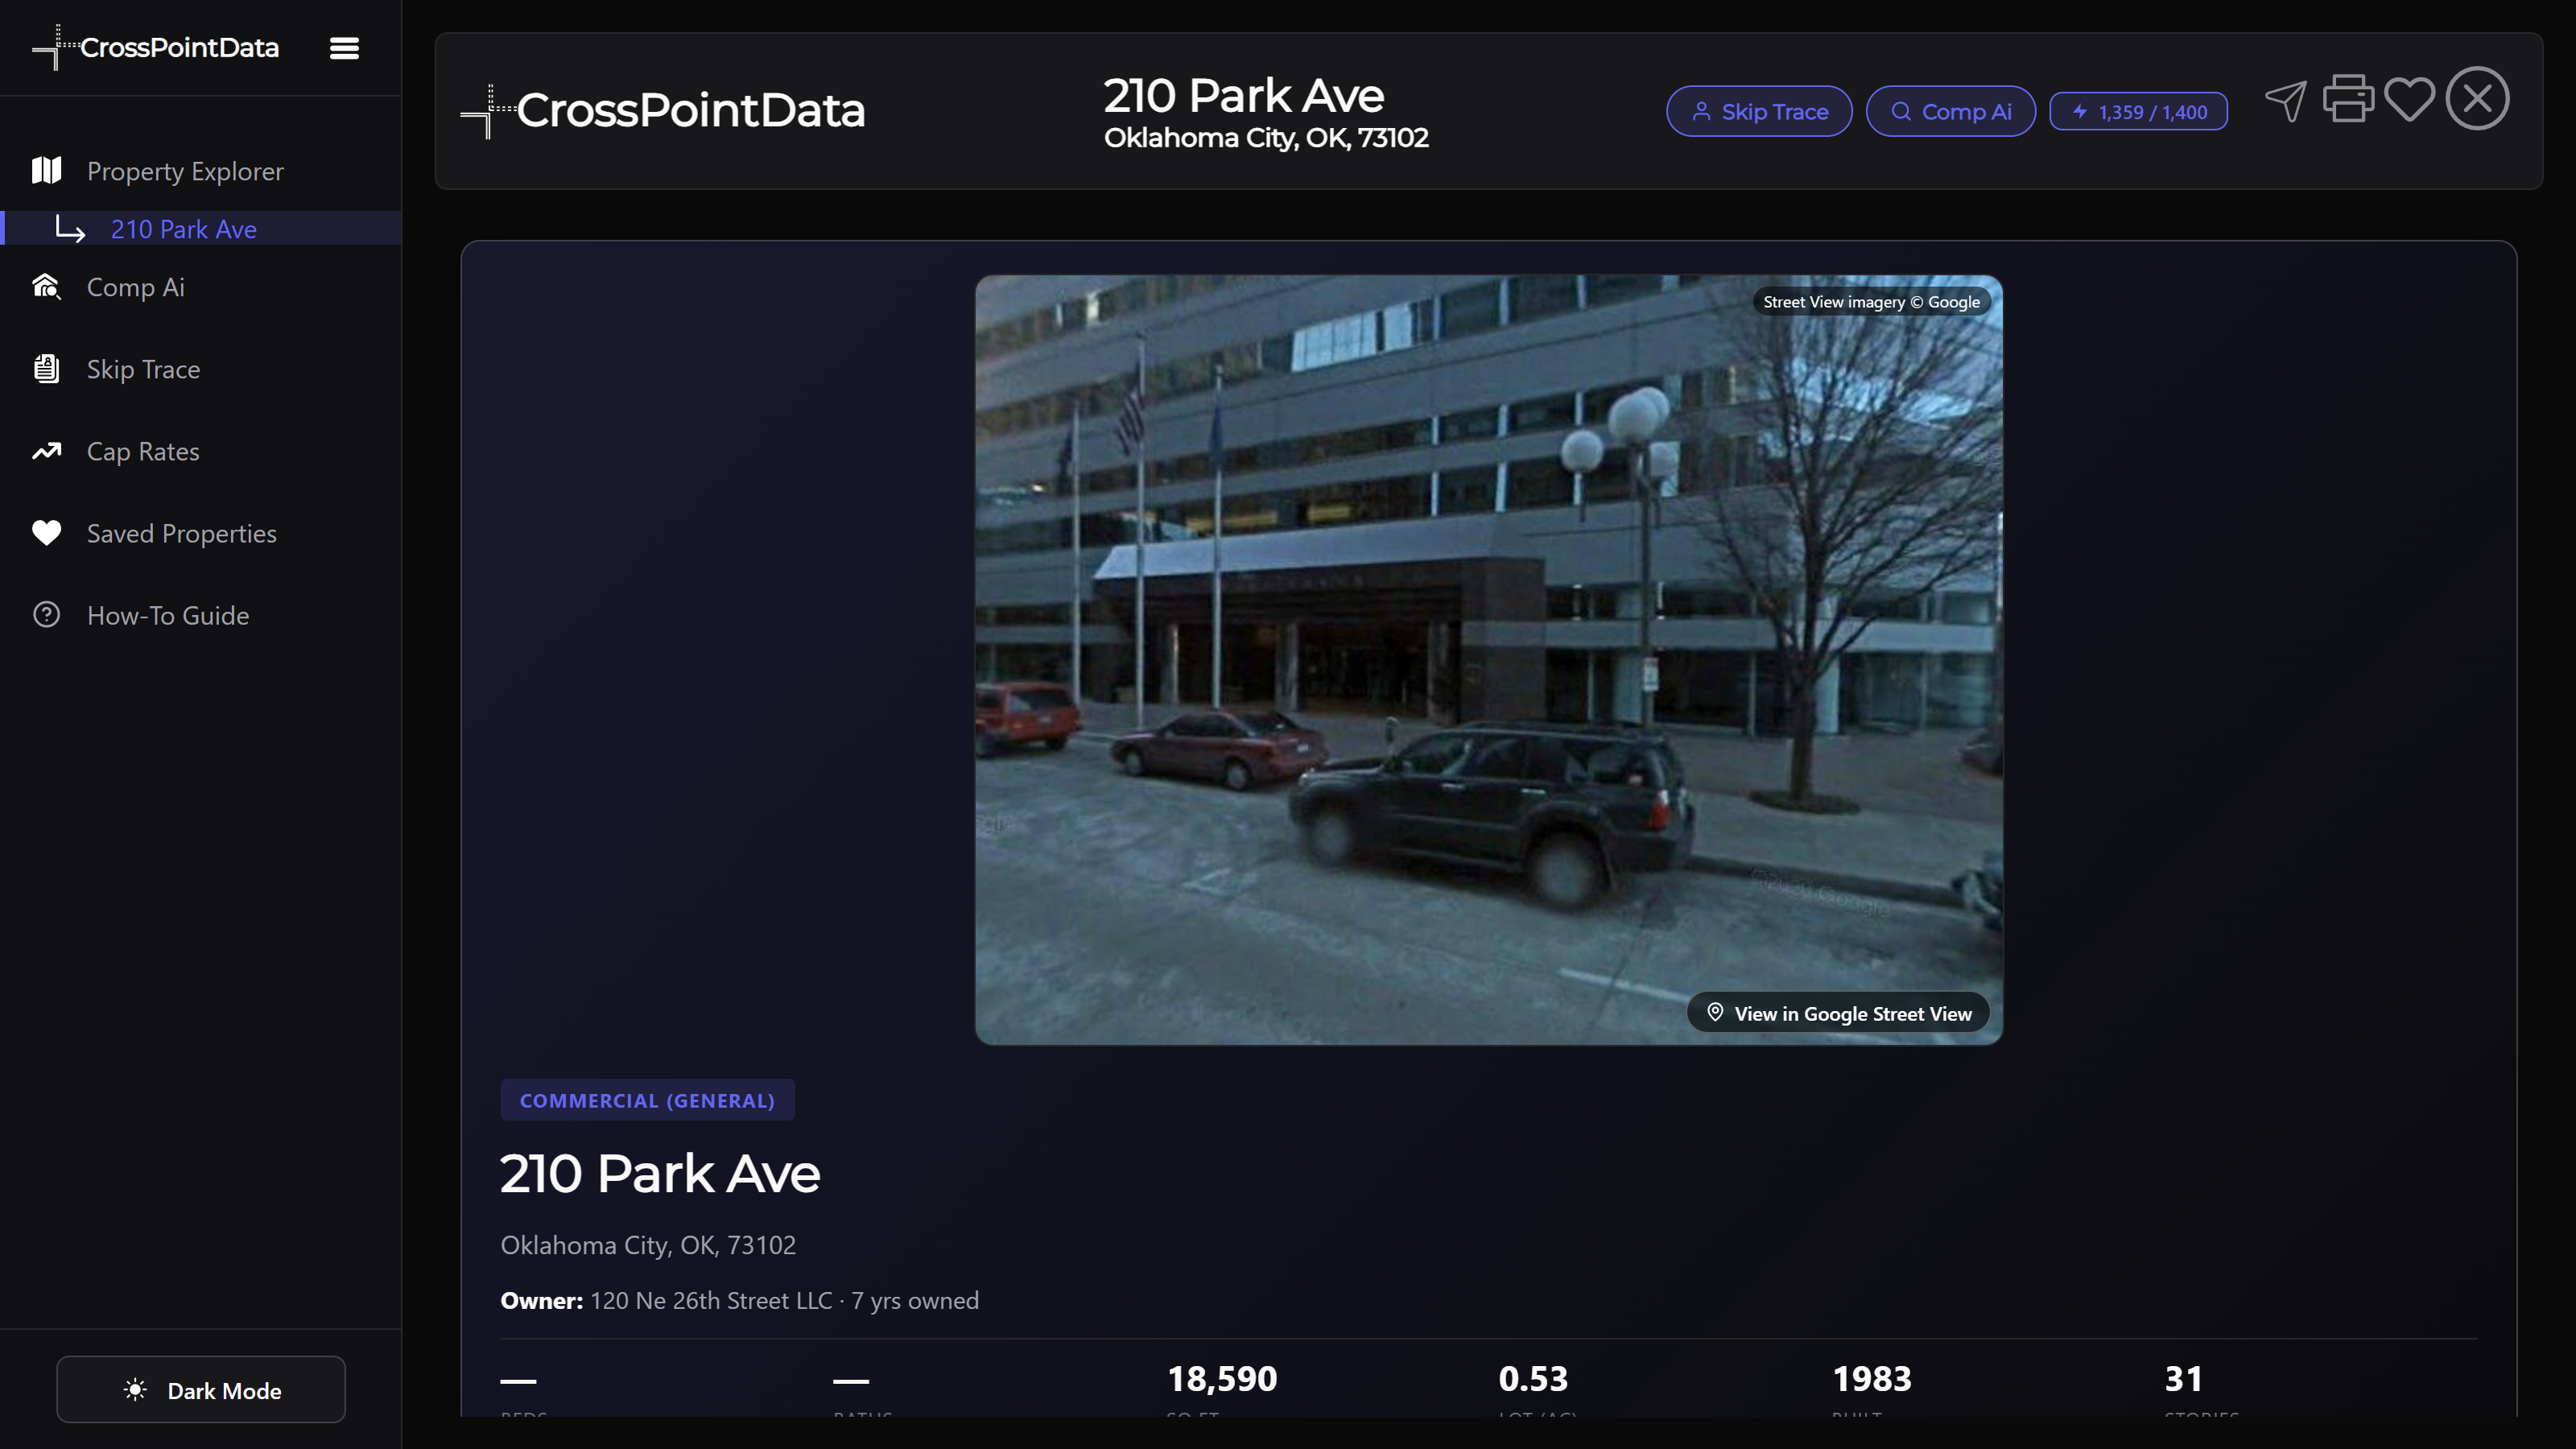
The record opens with the street-level photo, the owner and years owned, and the key stats in a strip: beds, baths, square feet, lot, year built, stories. The header holds the shortcuts: Skip Trace and Comp Ai pre-filled with this property, the share and print buttons, and the heart that saves it to Saved Properties. Reopening a saved property does not spend another credit.
Find comparable sales with Comp Ai
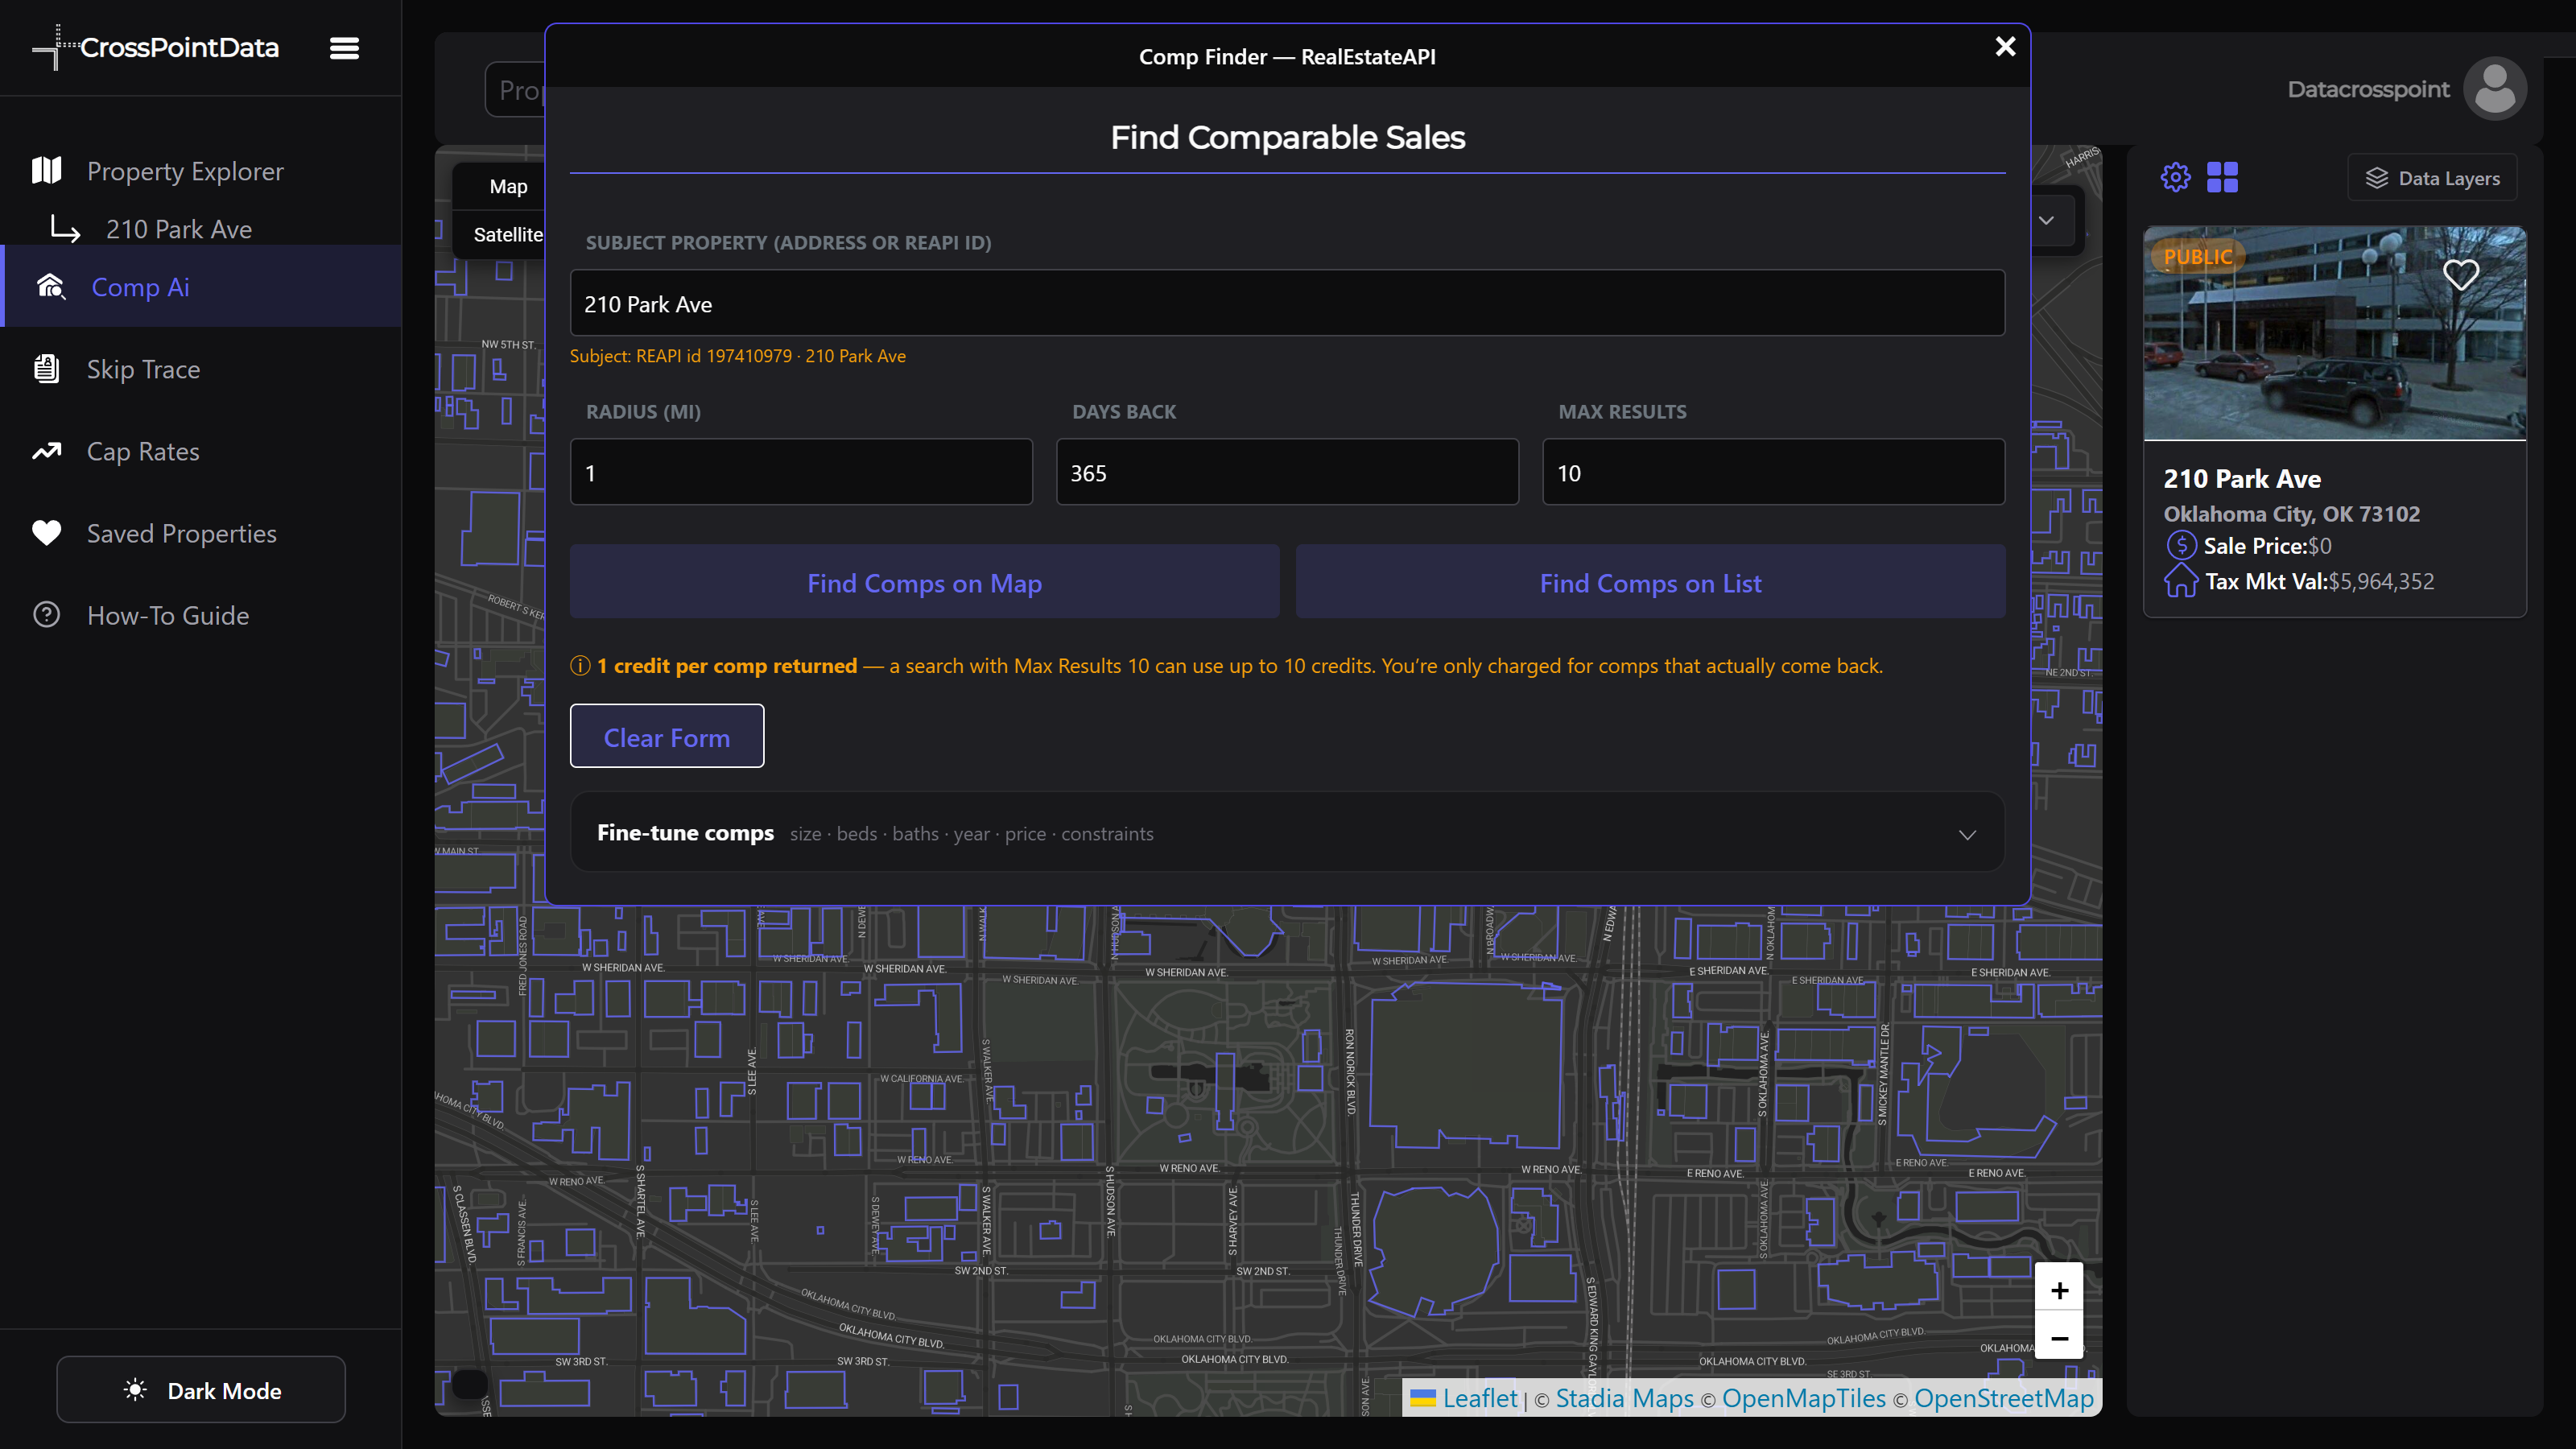
Open a property record and click Comp Ai in its header. The Comp Finder opens with the subject filled in. Set the radius in miles, how many days back to look, and the maximum number of results, then press Find Comps on Map to see them as pins or Find Comps on List for a table. The Fine-tune comps section constrains size, beds, baths, year and price.
Pricing is per result: one credit per comp returned, so a Max Results of 10 can use up to 10 credits. Comps that don't come back are not charged.
Skip trace an owner
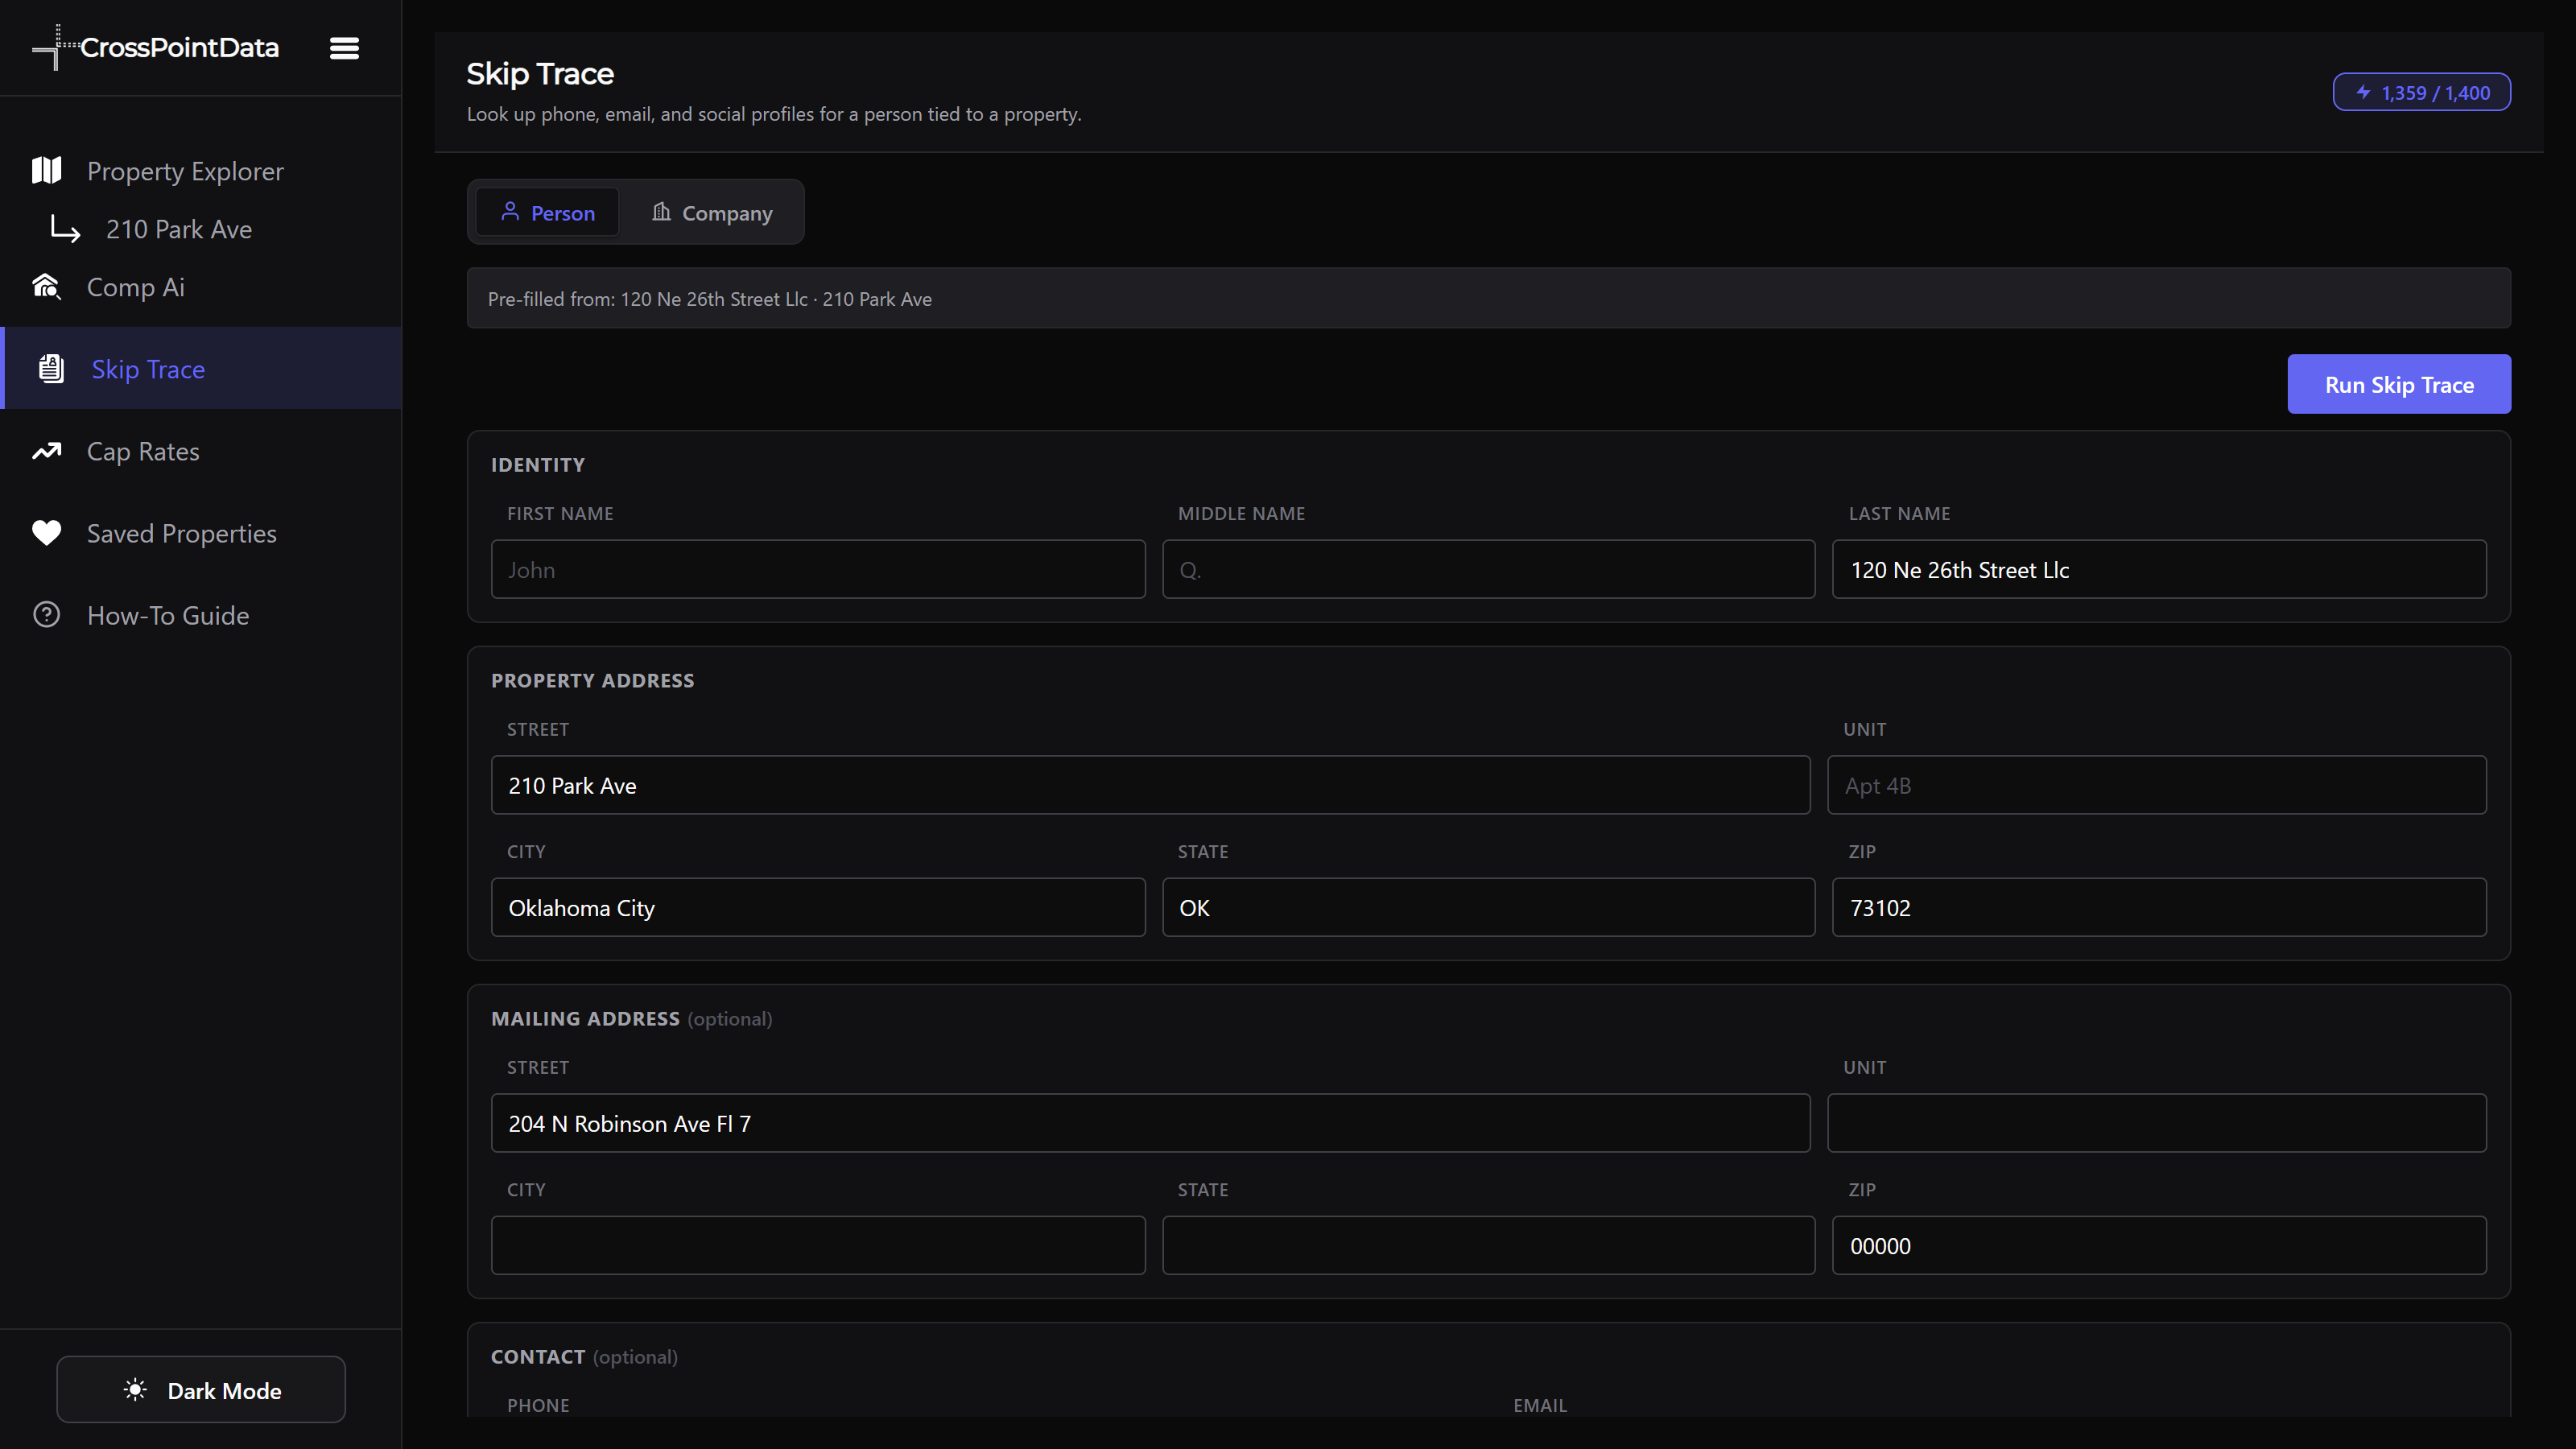
Open a property record and click Skip Trace in its header. The form opens with the owner's name and both addresses already filled from the record. Choose Person or Company to match the owner type, add anything you know in the optional contact fields, and press Run Skip Trace to pull phone, email and profile matches. You can also open Skip Trace from the left nav and type the details yourself.
Cap Rates and Saved Properties
Two more stops on the left navigation bar:
- Cap Rates holds the cap rate tools.
- Saved Properties lists every property you hearted. Reopening a saved property does not spend a lookup credit.
Comp Ai and Skip Trace need a Premium or Insider subscription; both are covered in their own topics above.
Where the layer data comes from
Every data layer comes from a federal public-domain source or an attribution-only open source: FEMA, NOAA, CDC/ATSDR, the U.S. Census Bureau, USGS, FHFA, Zillow and Redfin. The sources, coverage & methods page lists each dataset, its license, its coverage limits, and how the maps are built.
Can't find what you need? Email daviddecai@datacrosspoint.com or call (580) 277-5760. See also: sources, coverage & methods.